Introduction:
The Wave dashboard designer provides a quick and easy way to create responsive dashboards for any device. You can create a dashboard either by using the predefined templates which contain empty widgets (without the steps, sections and color scheme) or by using your own layout by choosing the blank template option. You can create dashboards, only if you are given Create and Edit Wave Analytics Dashboards permission. This article explains the following topics.
- Basic components
- How to create a dashboard
- How to create widgets
- How to create new steps
- Generate unique layouts for different devices
I. Basic components:
The wave dashboard designer contains the following elements.
- Canvas – It is your workspace where you place your widgets to create the dashboards.
- Widget toolbar – It contains a collection of different widgets which can be dragged onto the canvas to create dashboards. It determines how the data should be displayed.
- Step Panel – It contains the lists of steps needed to be used by the widgets. The steps will return the data to be displayed in the widgets.
II. Create a Dashboard in the Wave Dashboard Designer:
Step 1: Select Create => Dashboard in the home page.
Step 2: Select the template you want to create and click on the Continue button. You can select a Blank Dashboard in the Wave Dashboard Designer option if you want to create your own layout, or you can choose any other available predefined templates that has prebuilt dashboard design. Here I am choosing the blank dashboard to create my own template.
Step 3: Click on edit icon to edit the dashboard. You can provide a name for your dashboard here.
Step 4: Click on save icon to save your dashboard to an app.
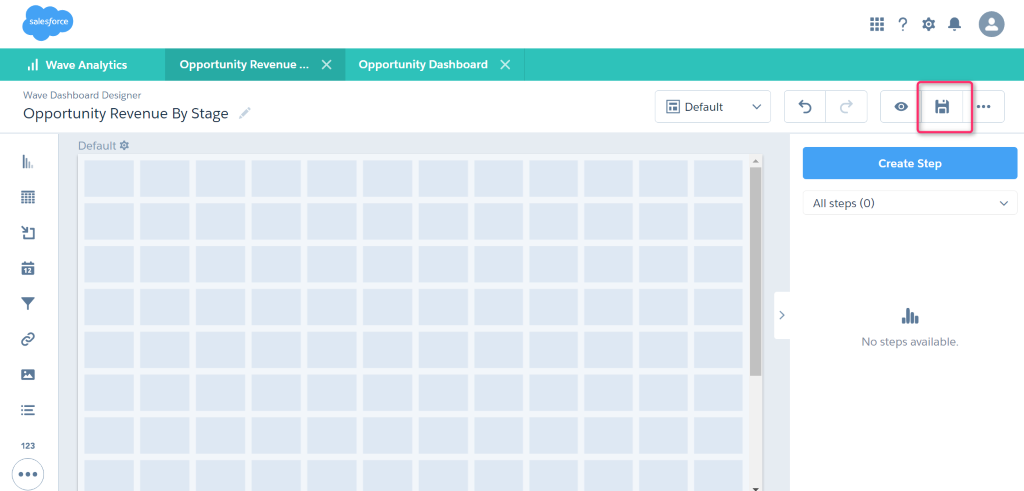
Step 5: You can provide title, description, and the name of the app where you want to save the dashboard and then click save.
It is possible to modify the default properties to meet your requirements by using the properties option, but it is better to leave the default properties as it is to ensure consistency of background, borders and other properties among all the widgets.
III. Adding widgets to the dashboard.
Step 1: Click the type of widget you want to use and drag it into the canvas area. For Example, I am choosing chart widget.
Step 2: If you have any existing steps, you can simply drag it from the step panel and place them on the widget. If the step panel is not visible, click the header of the dashboard to view the step panel. Also, you can create new steps for the widgets. Now, we will see how to create a new step.
IV. Creating Steps:
Step 1: Click the button that appears in the selected widget to add the steps.
Step 2: Now, the following screen appears with the list of most recently used datasets.
Step 3: Select the dataset in which you are going to create a step. Sometimes, you will see that the wave has already selected the previously used dataset. If you want a different dataset to use, Click on Create Step in the step panel window, or you can click on the Back button on the window and move to the previous window to choose a different dataset.
You can customize your data by using some excellent features available to you to further refine your data. The features are
- Measures
- Groupings
- Filters
a. The explorer appears with the rows count measure. You can change measures using the Measures option to show the count, sum, minimum, maximum and average of any field. Click measure button if you want to add a new one or select the existing measure in the explorer to update it with a new measure.
b. There is an option called groupings made available for you to group your data based on the specified field.
c. There is also an option available to further filter your data. To do filtering, Click on Filter option.
You can change the chart type depending on how you want to display it on the dashboard.
Step 4: After you made all the changes you need, click on the Done button. Wave adds the created step to the steps panel to make it available for other widgets also. Click on save option to make the changes available. Now, your dashboard appears as shown in the diagram.
I have created another chart widget with a sum of amount as Measures and grouped by opportunity stages.
Now the dashboard will look like the below screenshot.
V. Generate unique layouts for different devices
You can generate separate layouts for different devices such as desktop, mobile phones, tablets, apple watches. Each layout can have different widgets and designs. It is possible to arrange, remove or move widgets in a layout without affecting other layouts. Since there will be several layouts that have different widgets, the wave will take the widgets from the currently selected layout while creating a new layout. So, you need to select a layout that contains the widgets you want to include in your new layout during the creation of new layouts.
Step 1: Open the dashboard in the wave dashboard designer and select Manage Layouts from the layouts menu.
Step 2: You should enter a unique name for the layout and choose any existing layout template which will have predefined layout properties. We can change the predefined properties if we want.
Step 3: Click on Generate button to create a layout.
Likewise, you can create different layouts for different devices for an awesome appearance that fits into the device.
Step 4: After you click Generate button the new layout will be created and the layout panel appears in which you can change the default layout properties by expanding the sections if you need. If the layout panel is not displayed, click on the gear icon to show it.
After clicking the gear icon, you could able to see the layout panel now. In this layout panel, you could change the properties such as background, device properties if needed.
Step 5: If you want, you can rearrange the widgets. If you want to hide any widget, just select the widget and click on delete button.
The hidden widget will be moved to the Unused Widgets section of the layout properties.
Simply drag the widget from the Unused Widgets section to the canvas if you want to include the unused widgets in your layout. If you want to add a new widget, drag it from the widget toolbar to the canvas.
You should keep the point in mind that the wave will add all these changes only to the current layout on which you are working on. It won’t add the changes to the other available layouts. If you want to make changes to other layouts, you must open it and make changes to it separately.
Step 6: If you want to delete a layout, select Manage Layouts from the layouts menu and then click the cross icon present next to the layout.
Step 7: Save the changes you made to the dashboard using the save icon.
Pros:
The following are the special features that add powers to the wave dashboard designer for providing an efficient way to create responsive dashboards.
- It allows you to customize the entire chart appearances by introducing the new chart properties.
- Even it allows you to increase the number of columns in the designer grid by using the properties if you need to control the widgets easily.
- To further enhance the visualization of your data, Wave designer dashboards support the following new chart types: Flat Gauge, Pyramid, Polar Gauge, Rating, and Stacked Pyramid.
- It allows you to effortlessly move the widgets in a dashboard using the reflow features.
- It gives you more workspace when designing a dashboard by pressing the arrow to show/hide the respective panels that contains the properties.
- It allows you to set initial filters (only on filter selection widgets or charts) that are applied when the dashboard first opens. These initial filters will display the data dynamically based on the logged in user which can also be changed or removed if the user wants different results.
- It ensures to display the dashboard even though a problem occurs at any step. It will display an error icon on the widgets having that step and the remaining widgets are rendered properly.
Cons:
The following are some of the features which are not possible in the wave dashboard designer.
- The reflow features can’t be used if you are moving multiple widgets at the same time.
- The chart types (parallel coordinates, horizontal dot plot, vertical dot plot, matrix and pivot table) are not supported. The following changes occur if you navigate the dashboards created in classic designer to wave dashboard designer.
- If you used any of these chart types (parallel coordinates, horizontal dot plot, vertical dot plot, matrix) in classic designer, it will be converted to a bar chart in the wave dashboard designer.
- The pivot table chart type used in classic designer are visualized as a compare table in the wave dashboard designer.
Summary:
Thus, the wave dashboard designer reduces your work by creating responsive dashboards through its quick and easy features. It also provides an excellent way to create separate layouts for different types of devices without the need for JSON.
References:
Web Link: Wave Dashboard Designer.