Salesforce Integration
Cvent Integration with Salesforce
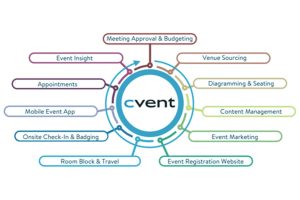
Cvent is a leading cloud -based enterprise event management platform. Cvent offers software packaged Cvent solutions to optimize the whole event management.
Cvent is a leading cloud -based enterprise event management platform. Cvent offers software packaged Cvent solutions to optimize the whole event management.
Data visualization is a graphical representation of data points or information. Human minds are not capable of understanding huge volumes of numbers; however, by using charts and graphs, you can understand trends, pattern and extract meaning or insights out of data.