INTRODUCTION
Before diving deep into Einstein Analytics, let us see the purpose of using Salesforce Einstein Technologies and how it will help us in our daily life. In today’s business world, new companies are emerging in various industries like Technology, Food, Automobile, E-commerce, etc. across the world minute-by-minute. As a result, the competition is getting tougher to increase sales, customer satisfaction, revenue, and profit margins.
To meet these ever-increasing customer acquisition and customer demands, the two useful tools each company possesses are Customer Data and Technology. Here, Customer data refers to the information related to customer buying interests and patterns, the company’s sales data across various months, and so on.
Technology refers to AI, which can work on existing customer data to predict, generate new sets of data, generate revenue and profits for the company.
Finally, Salesforce is one such platform that provides us these two tools in the form of Salesforce CRM to store and manipulate customer data and Salesforce Einstein Technologies as its AI tool to work on the available CRM data.
- AI in SALESFORCE
In general, Artificial Intelligence allows computers to learn like humans from experiences getting adjusted to new data and to perform tasks and produce results in a lightning speed saving time and labour.
When it comes to AI, there are four sub-branches that need to be known,
- Machine Learning which helps the computers to learn from the existing data and make new set of predictions and outcomes with minimal human intervention.
- Deep Learning is the successor to Machine learning with a set process to perform human-like tasks and produce simpler, advanced, and easily understandable outcomes.
- Natural Language Processing helps the computers to understand normal human communication via text or speech and extract the important pieces of information from them.
- Computer Vision helps the computers to understand the visual world like processing Digital images, videos animations from digital devices to react and produce valuable results from what they see.
At a high-level Salesforce AI (Einstein) implementation can be viewed like below
| AI Subbranches | SALESFORCE EINSTEIN IMPLEMENTATIONS |
| Machine Learning | Einstein Analytics |
| Deep Learning | Einstein Discovery, Einstein Prediction Builder |
| Natural Language Processing | Einstein Chatbot, Einstein Voice |
| Computer Vision | Einstein Vision |
- Luckily, Salesforce Einstein has solutions to manage a lot of business problems in Sales, Marketing, Service Cloud, etc with Einstein subbranches.
| SALESFORCE CLOUDS | SALESFORCE EINSTEIN SOLUTIONS |
| Sales Cloud | Einstein Activity capture, Einstein Account Insights, Einstein Opportunity Insights, etc |
| Service Cloud | Einstein Bots, Einstein Vision, Einstein Language, etc. |
| Marketing Cloud | Einstein Engagement Scoring, Einstein Messaging Insights, Einstein Engagement Frequency, etc |
EINSTEIN ANALYTICS:
- Einstein Analytics is an extended version of normal Salesforce Reports and Dashboards powered by AI.
- The main difference between them is that data visualization and representation are much more detailed and eye-capturing when it comes to Einstein Analytics. The other difference is that we can also work with data from outside of the native Salesforce Org in Einstein Analytics.
- The sales team can use Einstein Analytics features to gather the scattered data in and out of a particular salesforce Org to get a clear picture of the important real-time business data, to see how a business is performing in terms of revenue generation and profit margins of and make best decisions in your Sales & Marketing activities to attract new customers and to retain old customers.
- Discover the reasons behind customer behaviors and interests, channels where customers interact, and sales.
- GETTING STARTED:
- It is available in both Salesforce Classic and Lightning experience in the following Salesforce Orgs Developer Edition, Enterprise Edition, Performance Edition ad Unlimited Edition.
- Einstein Analytics is Currently known as Tableau CRM. Einstein Analytics is not a cost-free feature which can be enabled. There are three types of Einstein Packages
- Einstein Prediction – 75 $ per user per month.
- Tableau CRM Growth – 150 $ per user per month.
- Tableau CRM Plus – 200 $ per user per month.
To know about the full features and details of each package you can refer this link https://www.salesforce.com/in/products/einstein-analytics/pricing/
- To practise Einstein Analytics free of cost you can always register for an Einstein enabled developer edition org using the below link https://trailhead.salesforce.com/en/promo/orgs/analytics-de
- There are two prebuilt permission sets
- Tableau CRM Plus Admin to Administer Einstein features
- Tableau CRM Plus User to use Einstein features
The features of the above two permission sets vary for Tableau CRM Growth and Tableau CRM Plus licenses the only difference for Tableau CRM Plus Licenses there will additional accessibility to Einstein Platform.
- Finally, to Setup Einstein Analytics and to know more about the permission sets setup please refer the following link.
- COMPONENTS of EINSTEIN ANALYTICS.
There are five major primary components in Einstein Analytics
APP
- An app is like a Salesforce App like a folder which contains all other components like Dashboards, Lens, Datasets and Dataflow.
In the above image ABC Seed is the name of the App.
- Each user has their own app called as My Private App as that of a private report folder like user have in Salesforce.
- To create a new app, follow the below given steps
Click App Launcher à Click Analytics Studio à Create Button à Choose App à Select from given App Templates or Click Create Blank App à Continue à Name your App àOk.
DASHBOARDS
- A dashboard in Einstein is the overall visual representation of data as we see in normal dashboards but the data source between these two vary.
- An actual dashboard gets its data from reports but in case of Einstein Dashboards the data sources vary between datasets, SAQL and salesforce direct for the widgets.
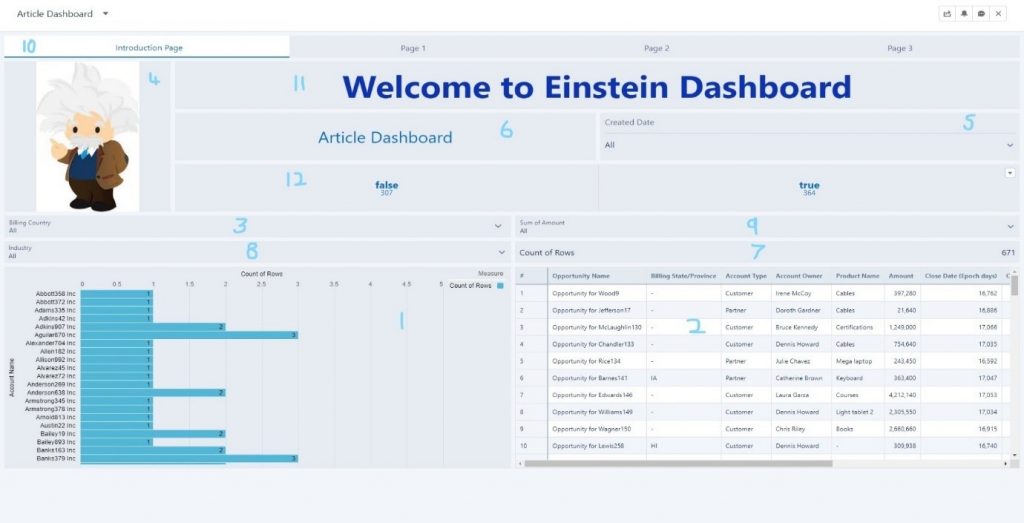
- In Einstein dashboards there are many components we can include by just drag and drop and we can work with as mentioned below
- To create a new app, follow the below given steps
- Click App Launcher à Click Analytics Studio à Create Button (Either outside or inside an App) à Choose Dashboard à Select Among given Dashboard Templates or Click Create Blank Dashboard
- If you choose Blank Dashboard option, Include all the required widgets inside dashboard editor à Click Save à Enter the Dashboard Name, Description, Version History, Choose the Appà Save.
- If you choose any of the Dashboard Templates, Enter the Name à Chose the App à Include all the required widgets inside dashboard editor à Click Save à Enter the Dashboard Name, Description, Version History, Choose the Appà Save.

| WIDGETS | DATA SOURCE | DESCRIPTION |
| Chart | Datasets, SAQL, Salesforce direct. | This widget includes a report chart as we see in normal dashboards. There are more types of charts when compared to normal charts. Some of them are Vertical Bar, Horizontal Bar, Pie, Donut, etc and the chart properties differ for each type (Refer 1 in the above image). |
| Table | Datasets, SAQL, Salesforce direct. | This widget helps us to display the data in the form of a table. We can use any one of three available types of table Values table, compare table, Pivot table (Refer 2 in the above image). |
| Filter | Datasets | This widget is used to create a filter as we see in normal reports using any one the fields from existing datasets (Refer 3 in the above image). |
| Image | No Data Source Required | This widget can be used to display any Image we need to include in the Einstein Dashboard. We can choose images from the gallery in Salesforce or upload one directly from our device (Refer 4 in the above image). |
| Component | No Data Source Required | This widget can be used to display any of our created Einstein Aura Component. |
| Date | Datasets, SAQL, Salesforce direct. | This widget is like filter widget, but filtering can be done only using a date field (Refer 5 in the above image). |
| Link | No Data Source Required | This widget can be used to link a URL in the form of a text. The link can redirect to an Existing Lens, Existing Dashboard, New Lens, Page URL, Page in Component and Mass Action (Refer 6 in the above image). |
| Container | No Data Source Required | This widget is like Image widget we have seen earlier. |
| Number | Datasets, SAQL, Salesforce direct. | This widget is used to display numerical data based on standard measures like Sum, Average, Max, Min, etc. We can also use a formula (Refer 7 in the above image). |
| List | Datasets, SAQL | This widget is used to list records according to measures we use as we see in number widget for a particular field. E.g., Listing out number of records (Count) based on the industry field (Refer 8 in the above image). |
| Range | Datasets, SAQL, Salesforce direct. | This widget is used to filter dashboard results based on range of values in a particular field. E.g., filtering using the values in the Amount field from 1000$ to 10000$ (Refer 9 in the above image). |
| Navigation | Datasets, SAQL, Salesforce direct. | In Einstein Analytics we can create multiple pages inside a dashboard to navigate between the pages we have created we use a Navigation Widget (Refer 10 in the above image). |
| Text | No Data Source Required | This widget can be used to include any text we need to show in the dashboard as a Dashboard Title, Instruction, etc (Refer 11 in the above image). |
| Toggle | Datasets, SAQL | This widget is like a filter widget, but it is most useful to filter the dashboard results when the values for a field are limited to a few values like record type, Account type, etc. (Refer 12 in the above image). |
LENS
- Lens is a way of visualizing each widget we include in a dashboard except those widgets which do not include any numerical data like image, text, container, etc.
- To visualize a data of each widget, there will be a downward arrow as shown in below image. By clicking it, we can choose Explore option to investigate the data as a new lens in a new tab from where we can build new queries if needed.
- Like other dashboard components, we can also build a lens from a scratch.

In the above image, you can see Explore option near the toggle widget.
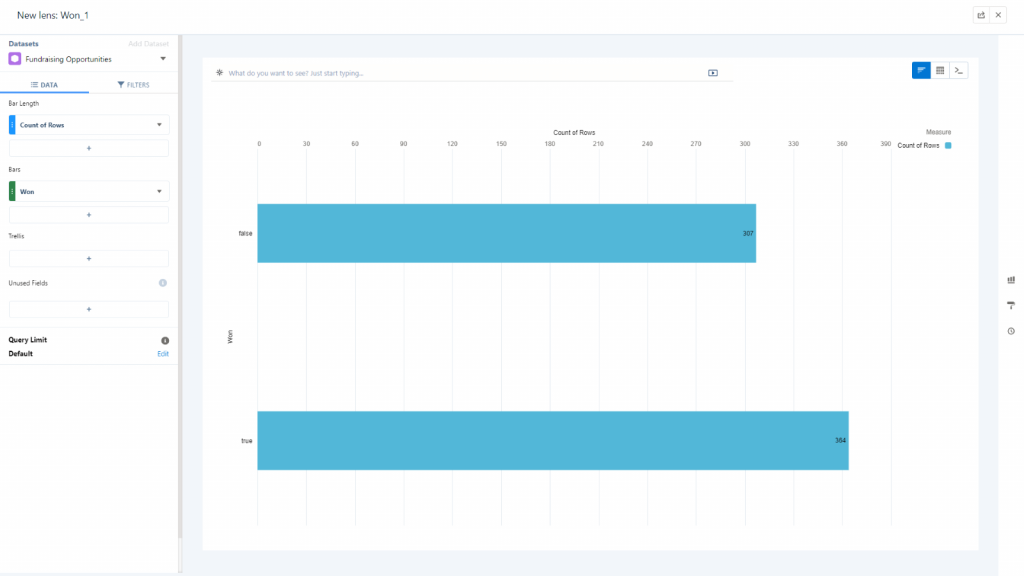
In the above image the toggle widget is opened in a new tab.
DATASETS
- As we have discussed earlier, Dataset is one of the primary data sources for the dashboard widgets involving data like Charts, Tables, Filters, etc.
- There are four diverse ways to create a dataset
- CSV File – Uploading data from a CSV file.
- Salesforce Data – Using data from related Salesforce Objects via a dataset or a dataflow.
- External Data – Using data from external database other than Salesforce CRM.
- Your Datasets – Using the data from a data recipe or already created datasets.
- We can use one or more datasets in a dashboard but if we need to communicate between two dashboard widgets, each has different datasets on a dashboard using a unique feature called Connect Data Sources.
NOTE: To create a Dataset, we must learn about Einstein Data Manager.

STORIES
- Einstein Stories can be used to get deep insights about the business from Statistical Data (Object fields) we use in a Dataset according to our required goals.
- We can also make predictions which provide us reasonably good idea where our business is lacking and take further steps to improvise our business model.
- Click App Launcher à Click Analytics Studio à Create Button (Either outside or inside an App) à Choose Story à Select Among given Story Templates or Create from Dataset
- If you choose Create from Dataset, fill in all the details à Click Story Type àChoose Insights or Insights and Predictions Option, Choose the Automated or Manualà Create Story.
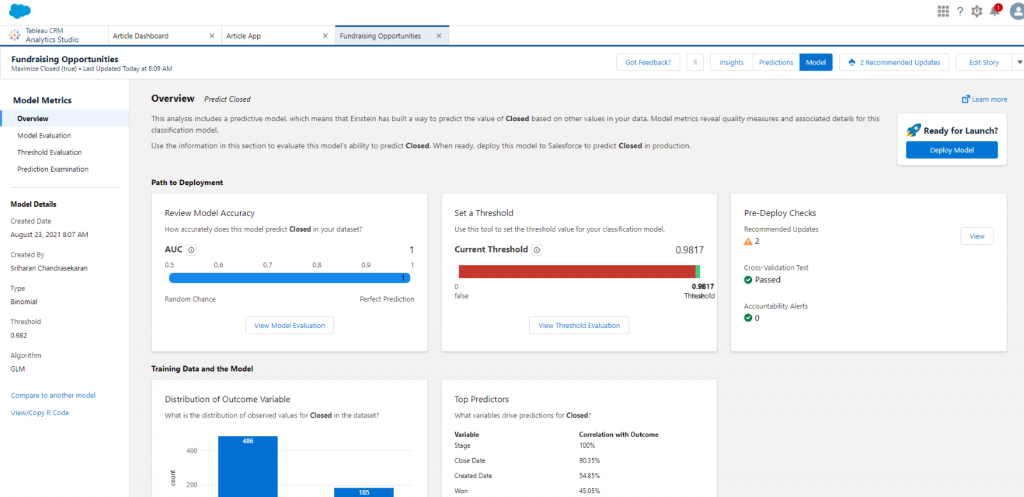
The above image is a story created using Create from Dataset option.
- If you choose any of the Story Templates, an Entire Einstein app will be created right from scratch with all the dataflows and components according to the type of template selected.
CONCLUSION
- Einstein Analytics is a powerful AI Tools provided by Salesforce to forecast insights, make predicted outcomes and in turn helps sales team members to take the next best action by providing them the key information about the patterns found in existing data.
- Einstein Analytics, as it is powered by AI, also saves time providing reliable information for a business to move forward in this competitive world in a cost-effective manner
