Datorama brings all your marketing data into one centralized view termed, Datorama Visualization. It provides an advanced tool — Data canvas — that allows building effective dashboards.
Collections (Dashboards) – Collections synergize all your data and consume it in one place; it is used to visualize, organize, and personalize data all together in a collection. A Collection has several pages.
Pages – Pages segment the collections. So, you can divide up the data according to the preferences such as product, campaign, and social media.
Widgets – Widgets are various graphic elements that appear on the page such as Bar Graphs.
Steps to creating and customise dashboard Pages
Create Collection (Dashboard)
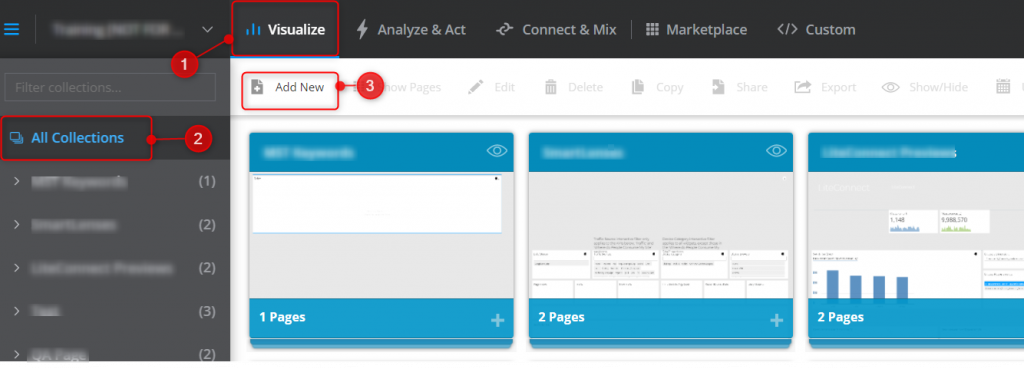
- Click on the (1) Visualize Tab > (2) All Collections. Then, click (3) Add New to create a new Dashboard/Collection:

- Enter a (1) Name for your new collection and click (2) Save.

Add Page to Collection (Dashboard)
- From this overview select the created collection/Dashboard by double clicking it.

- Click on Add New to add new page to the collection/Dashboard.

- Select Blank Dashboard Page to build page from scratch.

- Click on edit icon at the top right corner to turn on edit mode.

- Add Name for the page.

Add Date Filter for the page
- Click on the calendar icon to select the Date. The date filter is important because the data is always specific to a Date attribute.

- Select the Date Range from the (1) calendar or dropdown, click (2) Apply and then (3) Save.

Add and design widgets to the Page
- Click on the + icon at the top of the page to add widgets.

- Select the desired type of widget.

- Click on the + icon to add data to widget.
To display the data, at least one dimension and one measurement attribute should be selected.

- Select Measurements and Dimensions attributes to display in the widget.

- By Clicking on the attribute, you can change the display name of the field, the type, the axis the data to display etc.

- The widget looks like this; you can change the name of the widget in the provided area.

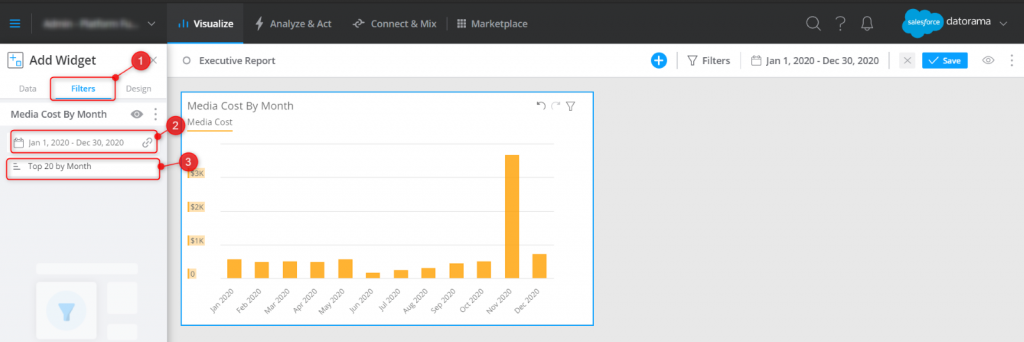
- From the (1) Filter tab, (2) Select the date filter specific for the widget and (3) the sorting order of the data.

- From the Design tab, set background colour, font, display position of the widgets. In the Advance option, you can also add custom CSS if required.

- Once done, click on Save option at the top right corner to save the page.
Designing a branded Page
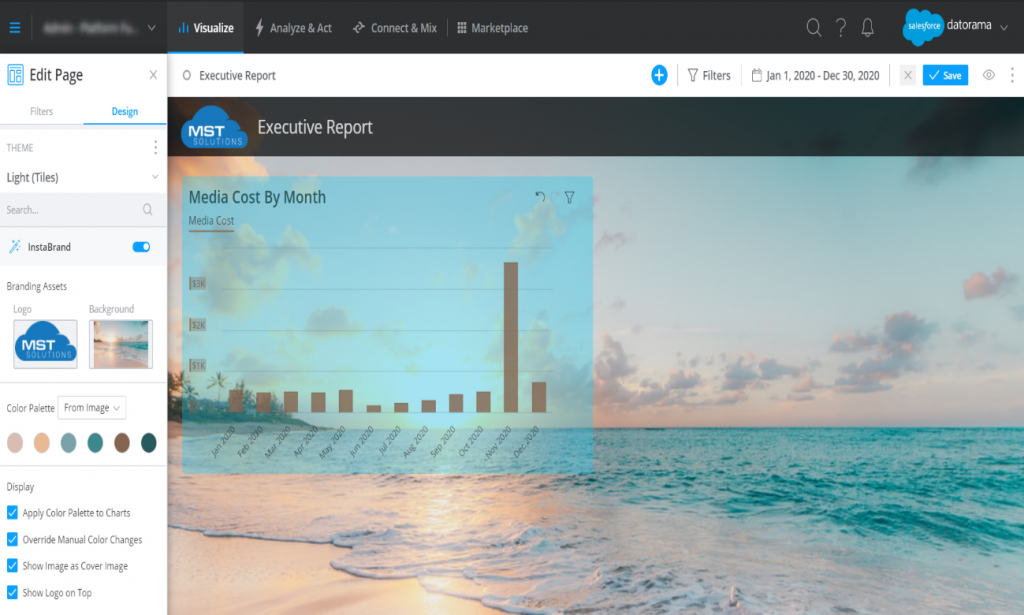
The Insta Brand changes the page to branded and eye catchy in couple of clicks. The color scheme of the page will automatically change according to the logos and background image added.
- Form the (1) Design tab. (2) Enable the Insta Brand, click the + icon and add the (3) logos and (4) background image.


- Click the Save button at the top right corner to save the page.
Conclusion
By using this Dataroma pages, generate branded and high standard statistical dashboards that present the data in a more efficient way.


