Data visualization is a graphical representation of data points or information. Human minds are not capable of understanding huge volumes of numbers; however, by using charts and graphs, you can understand trends, pattern and extract meaning or insights out of data.
In this article, we are going to illustrate the visualization capabilities of Tableau and data manipulation functionalities in python.
Data Manipulation:
Python is one of the greatest tools for data science and analytics. It has great libraries like Pandas, Scikit-Learn, Matplotlib, etc.?
We will be using the Pandas to clean up our banking dataset.
Data?manipulation is the process of changing?data?to make it easier to read or be more organized. Pandas contain a data frame which is nothing but SQL like tables. It is highly flexible for data manipulation. Pandas contain a wide variety of functionalities to deal with data. It is more friendly for data-pre-processing.
Data load:
Data load is the process of obtaining and importing data for immediate use or storage in a database. Pandas is one of the powerful data science libraries in python. It is used to consume, manipulate, and clean data. Pandas support a wide variety of file formats like CSV, JSON, Excel…. to load as a data frame.
Below figures show how to load data into a panda data frame. Now, we are loading the UK bank customer’s data. In this link, you can get the UK bank customer’s data.https://sds-platform-private.s3-us-east-2.amazonaws.com/uploads/P1-UK-Bank-Customers.csv?

In this below example, we are filtering out the gender and bank balance details and showing the first five rows.

Data Cleaning:
Data cleaning is an important process in the data science life cycle. Real-world data is always messy; it is important to clean the data before digging insights out of it. If you have a clean dataset, you will good results; when you use messy data, you are more likely to get wrong results.
In this below example, we cleaned the banking dataset using pandas
strip() is used to remove whitespace
capitalize() is used the change the lowercase letter to uppercase letter

Tableau:
Tableau is a simple and powerful visualization tool used for creating interactive dashboards. It is widely used in the business intelligence industry. We can analyse data very quickly and extract meaningful insight out of data; we can create customized dashboards in very less time.
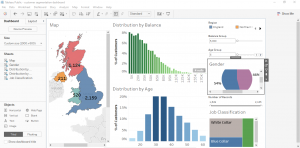
Drilling–down the data:
We have selected the United Kingdom in the map. Then, the whole dashboard changes accordingly allowing the user to drill down and understand the data.
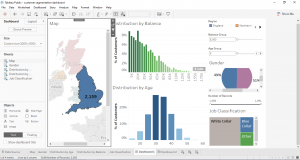
In the below picture, we have applied multiple filters and understood the data in an efficient way; likewise, we can get whatever information we needed from this interactive dashboard

Summary:
Data which needs to be visualized is loaded into the Python platform using Pandas. All the data loaded will be cleansed through Pandas. Finally, the cleaned-up data can be used for displaying dashboards using Tableau.
As the user accesses the dashboard through drag and drop in Tableau, it acts as the best visualization tool.
References:
https://www.udemy.com/course/tableau10/
https://www.youtube.com/watch?v=CmorAWRsCAw&list=PLeo1K3hjS3uuASpe-1LjfG5f14Bnozjwy
