- This article gives you a brief detailing about the Data Manager as this is one of the most important aspects in Einstein analytics because this defines the output (data) which will be displayed in Einstein dashboards.
- Data Manager is mainly used for data integration; so that; our created Einstein Dashboards show us the visualizations of up-to-date data.
- Data manager is also used to fetch data from external data storage orgs like other Salesforce orgs, MuleSoft orgs, Snowflake orgs, AWS Orgs, etc. by establishing connections.
- Data Manager is also used to schedule and monitor dataflows, recipes internal and external data connections and so on.
- Steps to open Einstein Analytics Data manager
Step 1: Click App Launcher Icon on the Salesforce Home page.
Step 2: Choose Analytics Studio.
Step 3: In the Analytics Studio Homepage, choose the Data Manager option in the left side panel.
- Einstein Analytics Data manager is made of 4 sections
Section 1: Monitor
Section 2: Dataflows & Recipes
Section 3: Data
Section 4: Connect
SECTION 1: MONITOR
- Monitor Tab shows the progress of scheduled data jobs like Scheduled Dataflows, Recipes, Datasets and Connections.

- Monitor Tab has two sub tabs
- Jobs – Shows the status of the scheduled data jobs.
- Dataflows – Can be used to schedule dataflows and track the progress of the scheduled dataflows as in Dataflows & recipes section.
SECTION 2: DATAFLOWS & RECIPES
- This section is the most important section in the Data Manager as this section discusses the Dataflows which lay foundation for the Datasets created directly using the Local Salesforce Data as shown in the screenshot
- This section also discusses the Recipes which is created by combining two or more datasets.
DATAFLOWS
- Dataflows are used to extract data and transform them in a report friendly format like adding an extra column calculating mean averages, adding data columns from two different Salesforce objects, establishing row level security as in actual Salesforce org, etc.
- This section shows information like the scheduled time and Last Modified by for the Dataflows.
- We can also create a new dataflow as shown in the screenshot using the Create Dataflow Button and schedule them.

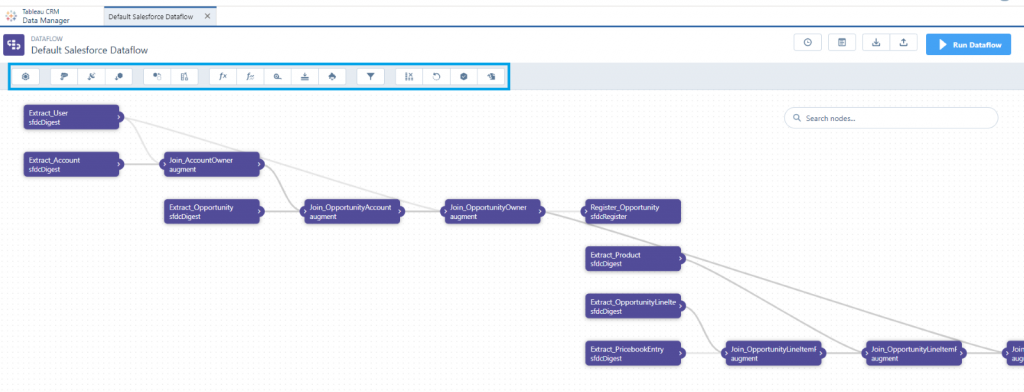
- Dataflow editor allows users to include transformations (highlighted in the Screenshot) while creating Dataflows.
DATA TRANSFORMATIONS
There are 16 types of transformation available in dataflow editor a user can use.
- SFDC Digest
This transformation is used to extract data from local Salesforce org like the fields from an object. We can also filter the records we want to display using filter conditions during the time of creation.
NOTE: There SFDC_LOCAL connection established before using this transformation
- Digest
This transformation is like SFDC digest, but this is used to extract data from External Salesforce orgs or databases with the help of connection established using Salesforce External Connector.
- Edgemart
This transformation is primarily used if a user needs to include some data(columns) from the external dataset.
- Append
This transformation is like Edgemart but here we can get rows from multiple datasets and combine them as one to use.
- Augment
This transformation is all about establishing relationships and combining data from two nodes which are already in use into one. For example, combining the data from two SFDC Digest Nodes with the help of a relationship established in Augment.
- computeExpression
This transformation is used to do a row-based calculation across a single record and display the result in a new computed field. For example. Multiplying quantity and unit cost and displaying total price in a new field (column).
- computeRelative
This transformation is used to do a column-based calculation across multiple records. This transformation is best suitable when we need to sort the data displayed in a dashboard or grouping the data and so on.
- dim2mea
This transformation is used to change the dimension (Boolean or picklist data) of a data column from a node and convert them into a measure (numerical data). For example. Converting true Boolean value of a data column from a data node and transforming them as 1.
- flatten
This transformation is used to establish row level security in the dashboards with the help of a hierarchy. The main field that is used to establish this is ParentRoleId field in user Role object.
- filter
This transformation is used to filter the data as the name suggests. There are two types of transformations
- Using a field like Stage to filter Opportunity records
- Using a SOQL query to filter
Data can be filtered using a filter condition in sfdcDigest but it is better to use filter transformation as the results are calculated in a separate node to avoid confusion.
- sliceDataset
This transformation is used to drop some columns from a dataset if they are not needed after certain stages in the overall transformation process.
- Update
This transformation is used to update certain field values in a data node by referring to the field values into other data nodes acting like a lookup.
- sfdcRegister
This transformation is used to assemble all the information of the data transformation process and register them as a dataset for the end users to use while creating Einstein dashboards.
- prediction
This transformation is used to perform Einstein prediction (Analyzing historical data to make future predictions) on a selected data node and the results are displayed in a new column in dataset
- export
This transformation is used to create a data file and a schema file with all security permission (using security predicates in sfdcRegister datasets) for a specified data node in the dataflow
- datasetBuilder
This transformation is used to create datasets (Discussed in Section 3) directly inside a Dataflow Editor
RECIPES
- This section shows the important information about created recipes like the scheduled time and Last Modified by, etc.
- We can also create a new recipe from scratch using the Create Recipe Button.

- Recipes provide the same functionality as Dataflows but creating recipes is simpler and requires few steps to create one.
- The main advantage of using recipe over dataflow is that we can preview data columns (result) at each step (node) during the creation process.
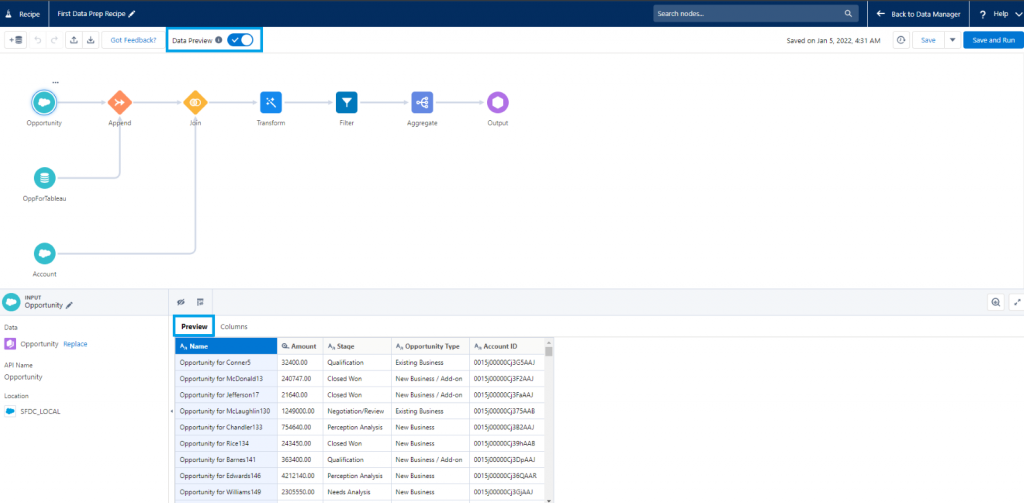
- Creating recipes is easier to understand and create for beginners due to its simple format.
- There are 8 different types of nodes we can use here to perform transformations on data
- Input
- As the name suggests, this node is primarily used to get the data for the recipe.
- There are three types of data sources used here
- Data from Datasets
- Data from Connected Objects (SFDC_LOCAL)
- Data from Direct data.
- We can choose one, two or all three at a time depending on the data requirements.
- Append
- This node is used when we want to combine the same type of data from different data sources.
- If there is a difference in the field names between the data sources, we can map the fields to ensure data consistency.
- Join
- This node is used when we want to combine different types of data like combining Opportunity and Account Data.
- The data combination takes place with the help of a common key field present in both the data node like an Id field– in case of Opportunity and Account, it can be AccountId.
- There are 5 types of join we can perform here
- Lookup Join
- Left Join
- Right Join
- Inner Join
- Outer Join
- Transform
- This node contains various types of transformations like creating a bucket, dropping unwanted data columns, etc. we can perform transformations we see in dataflow.
- There are 15 types of transformations we can perform
- Bucket Transformation: Categorize Column values
- Cluster Transformation: Segment your data
- Data Type Conversion Transformation
- Date and Time Transformation
- Detect Sentiment Transformation
- Drop Column Transformation
- Discovery Predict Transformation
- Extract Transformation: Get a Date Component
- Edit Attributes Transformation
- Flatten Transformation
- Format Dates Transformation
- Formula Transformation
- Predict Missing values Transformation
- Split Transformation
- Time Series Forecasting Transformation
- Filter
- This node is used to filter the data from previous nodes as the name suggests, like filtering Opportunity Records by their Stage.
- Two or more filters can be used here.
- Aggregate
- This node is used to perform aggregation operation on the given data and group them by rows and columns if needed.
- We can also perform a special type of aggregation called hierarchical aggregation to perform roll up calculations across hierarchical data.
- List of aggregation operations that can be performed
- Unique
- Sum
- Average
- Count
- Maximum
- Minimum
- Stddevp – Calculates the population standard deviation
- Stddev – Calculates the sample standard deviation.
- Varp – Calculates the population variance.
- Var – Calculates the sample variance.
- Discovery Predict
- This node allows us to use created Einstein predictions upon the data to give a prediction parameter
NOTE: There should be an Einstein prediction already created to use this node.
- Output
- This node gathers the end data and converts them into a dataset to be used in future.
- This is like SFDC Register transformation in Dataflows.
DATAFLOWS AND RECIPES COMPARISON
Reference: https://help.salesforce.com/s/articleView?id=sf.bi_integrate_prepare.htm&type=5
| FEATURE | RECIPE | DATAFLOW |
| Preview Data | ||
| Traversing back and forth to make changes | ||
| Edit Underlying JSON Code | ||
| Get to know Column details | ||
| Aggregate | ||
| Append | ||
| Bucket | ||
| Calculate Expressions (across rows) | ||
| Calculate Expressions (same row) | ||
| Cluster | ||
| Convert Column Types | ||
| Date and Time | ||
| Delta | ||
| Detect Sentiment | ||
| Drop Columns | ||
| Edit (Column) Attributes | ||
| Extract Date Component | ||
| Extract Dataset Data | ||
| Extract Salesforce Data | ||
| Extract Synced Data | ||
| Filter | ||
| Flatten Hierarchies | ||
| Format Dates | ||
| Join | ||
| Lookup | ||
| Predict Missing Values | ||
| Predict Values | ||
| Profile Column | ||
| Split | ||
| Time Series Forecasting | ||
| Update Values |
SECTION 3: DATA
- Datasets are primary sources of the Einstein Dashboards as Salesforce Objects in normal Reports and Dashboard.
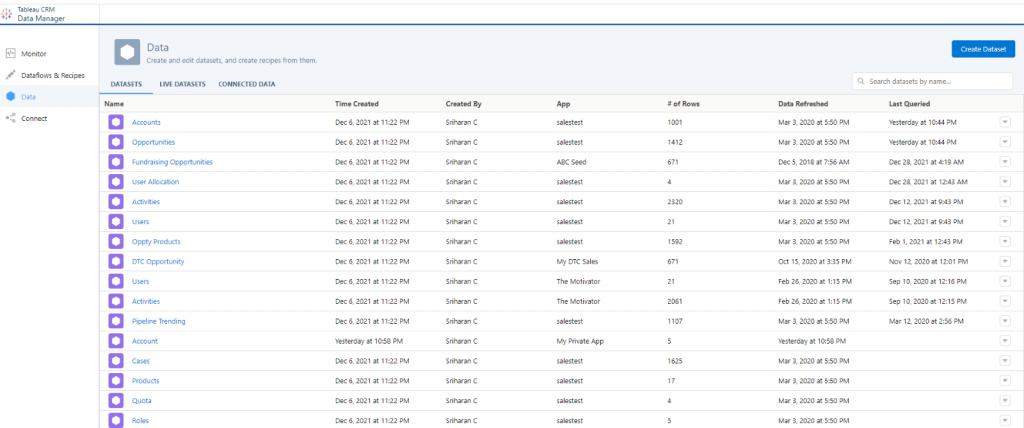
- This section shows all the information about the data sources available for Einstein Dashboards that are currently in the org.
- We can also create a new dataset in this section using the Create Dataset as shown in the screenshot.
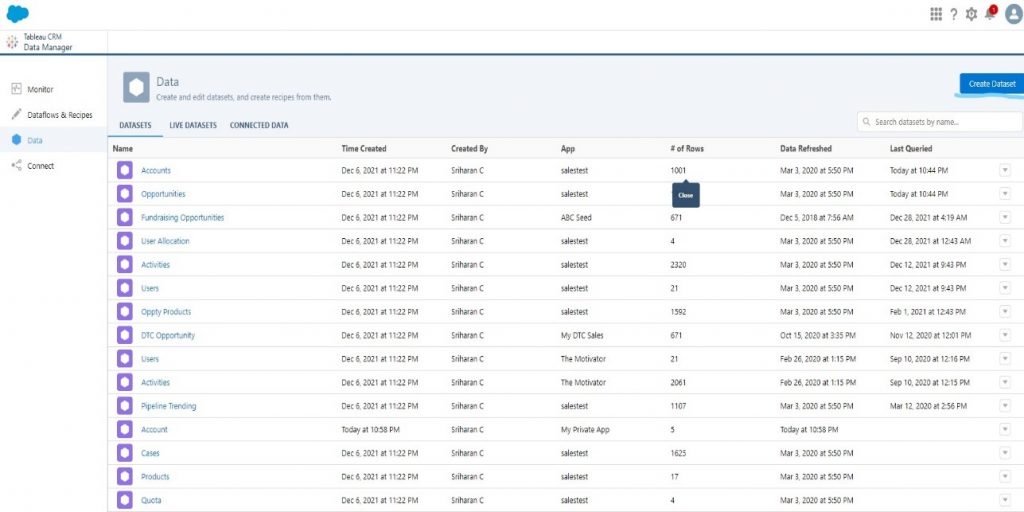
- Click the Create Dataset Button
- Upload the CSV file from your device. Click Next.

- Check the Dataset Name and select the App where the Dataset needs to be saved.

- Check the Columns that need to be displayed and change the measure of the columns if needed
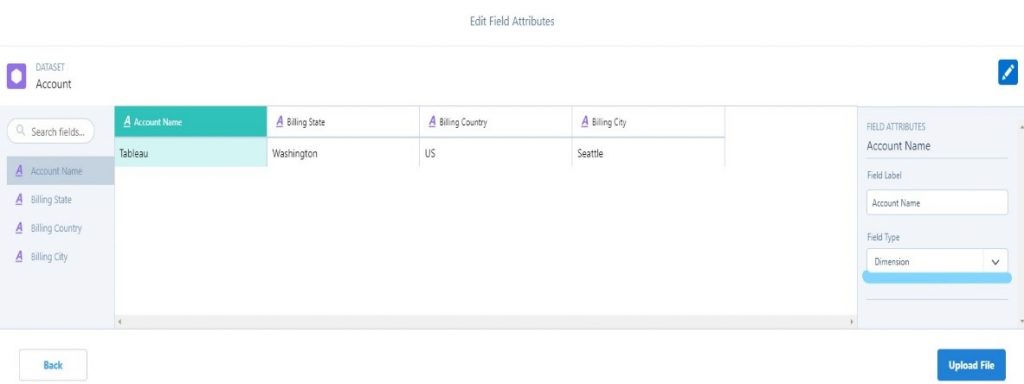
- Click the Upload File Button as shown in the previous screenshot
- It takes a few seconds for the dataset to be created. This process can be monitored in the Monitor section (Section 1) of the Data Manager.
- You can also schedule the created Datasets as other Data Components.
NOTE: We can also create Datasets directly in Analytics Studio as shown in the below screenshot
- This section is divided into 3 sub sections
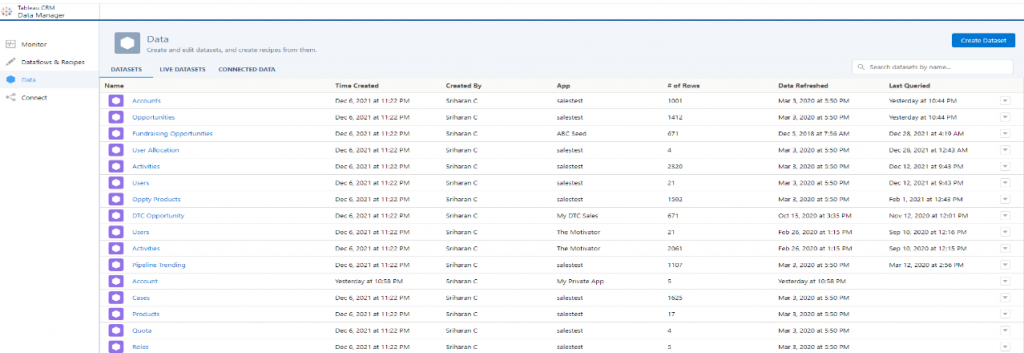
- DATASETS
This sub section just shows the information about the datasets like Name, Time Created, Last Queried as shown in the below screenshot.
- LIVE DATASETS
This sub section just shows the information about the data which available due to the Live Connections like Snowflake Direct Connectors, and Salesforce CDP Direct Connector we make in the Connect Section.
- CONNECTED DATA
This sub section just shows the information about the object data which occurred due to the Input Connections like SFDC LOCAL (Default) we make in the Connect Section.
SECTION 4: CONNECT
- This section displays current connection we have established with other databases when we open it
- This section is primarily used for establishing connections with other databases depending upon the type of connection we choose here.
- The connections are created by clicking the Connect to data button as highlighted in the screenshot below and choosing the type in further steps

- Only one connection can be established for a single database irrespective of the type of connection used.
- Types of connections available
- Input Connections – This type of connection is used to connect to local Salesforce org or external Salesforce org or external data source for Dashboards Input data and sync it.
- Local Salesforce org is connected by default by SFDC_LOCAL. If we want to create another internal connection, we can use the Salesforce Connector under Input Connections.
- External Salesforce org is connected using Salesforce External Connector under Input Connections.
- For external databases other than Salesforce, there are separate connectors for each of them. E.g.: For Marketo databases there is a Marketo Connector and Google BigQuery Connector for Google BigQuery databases and so on.

- MuleSoft Connections – This is used to establish connections to MuleSoft databases like MuleSoft Oracle, MuleSoft SQL, MuleSoft MySQL databases

- Live Connections – This is used to establish connection to databases with live data like Snowflake Databases and Salesforce CDP Direct.

DATA SYNC
- If we create any new datasets or recipes or dataflows or new connections, we must run them by using Run Now or you can schedule them by minutes, hours daily or week according to your choice; so that, the up-to-date data will be reflected in the Einstein Dashboards.
- Otherwise, there will be data discrepancies between the data in your database and Einstein dashboards
