Overview
Einstein Data Discovery enables business users to discover pertinent facts and themes in your data without any software and statistical models resulting in a pictorial representation of the business process with clear predictions.
To create a story for analytic cloud Einstein, we have the following steps.
- Dataset
- Field Settings
- Story Setup
- Create Story
- Share and Export Story
Data Set
To create a story, you must create a dataset which holds the list of records in it. Import data into Einstein Data Discovery from any source like Salesforce, CSV files, Oracle, Microsoft SQL server, Postgres, MySQL, Hadoop, SAP, Netezza. Get suggestions on how to improve the data quality of your dataset, review the suggested changes, and make data improvements.
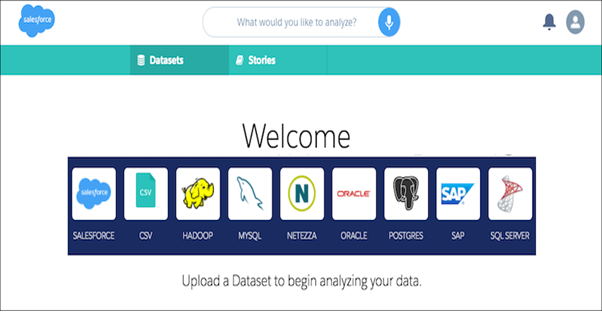
Create Dataset by uploading CSV file
To create a dataset with .csv file, we need to upload CSV file as given below,
- Click the CSV icon
.
- In the file selection, find and select the CSV file.
- Import the CSV file.
Data Improvements
It will give some recommendations to improve your dataset in a standard form. Either you can do it or ignore it based on your business need.
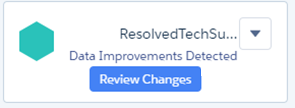
- Click Review Changes to improve our dataset. Einstein will give the suggestions to improve your data.
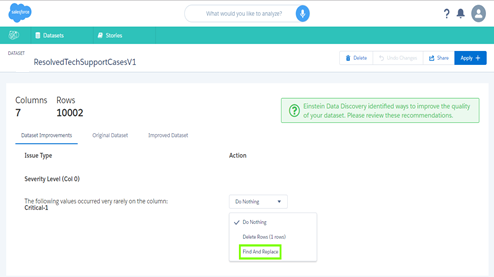
- Choose the Find and Replace option to do the changes.
- If you do not want to do any changes, select Do Nothing.
- If you wanted to Delete rows, you can choose Delete Rows option.
Text Field Recommendation
While doing the data suggestions, it will recommend for any text field that is different from others. If you would like to change the spelling or work as per the suggestions, following will explain you the way to do it.
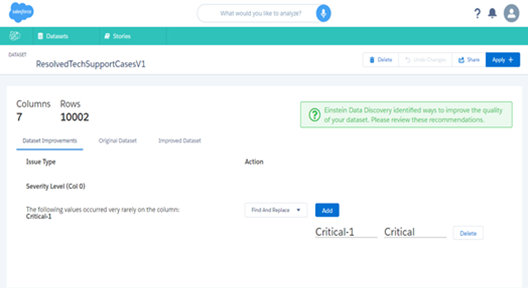
- Click add.
- Enter Critical-1 in the find field and Critical in the replace field.
- Click apply in the upper right corner.
Field Settings
Following screenshot shows the fields used in the data set .csv file for the settings. Each field has its Type, Field names, Delete, and Setting options.
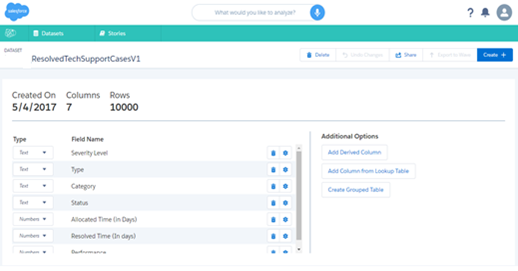
- Click the garbage icon to delete the field.
- Click the gear icon in Number field or Date field. It will show the minimum and maximum value of that field.
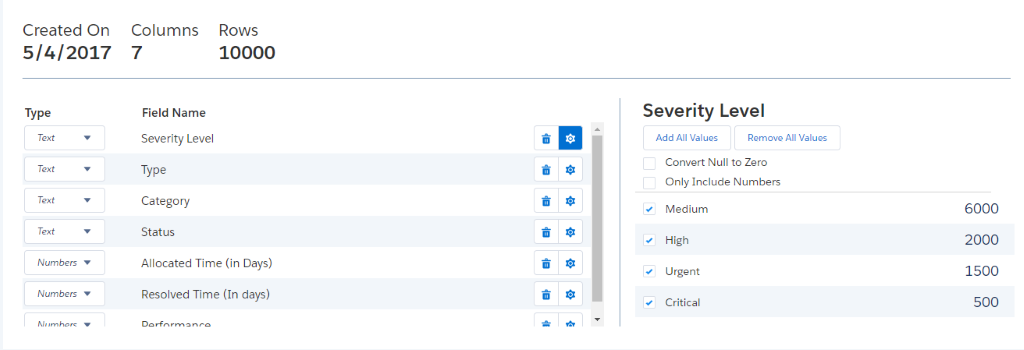
- Click the gear icon in text field. It will show the values of that field and show the options like add values and remove values.
- You can also choose to convert null values to zero or only include numbers.
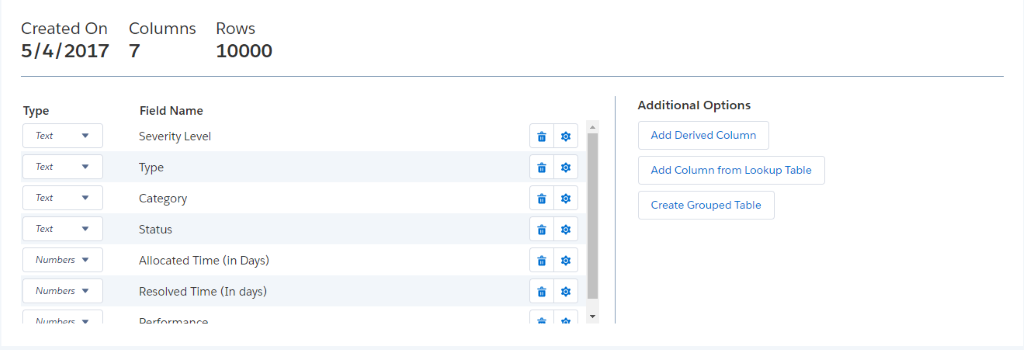
- Add Derived Column – It uses mathematical formulas to create new columns with the help of existing columns.
- Add Column from Lookup Table – To add data from another dataset.
- Create Grouped Table – To create a single row from multiple rows.
Story Setup
Here you can see, Maximize the variable <variable> in <dataset>.
- Click down the arrow beside the variable and choose Maximize or Minimize with one field in dataset. This is called outcome variable.
- Select Maximize to see outcome variable increase or Select Minimize to see outcome variable decrease.
- Others are the optional settings on the story setup page.
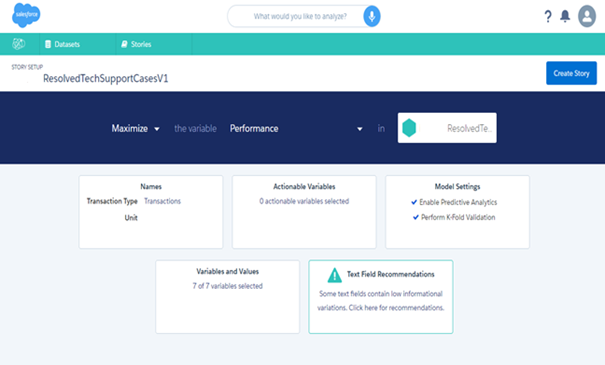
- Names – You can change the transaction name and units to improve the readability of the story.
- Dates – If date column contains in your dataset, then you will see the dates tile in story setup. It is used to analyse the change over time of the business compared by daily, weekly, quarterly, yearly.
- Actionable Variable –It will recommend what actions you should take. Only 3 variables can be actionable.
- Model Settings – It is used to specify which analysis are run.
- Enable predictive analysis
It creates the predictive model for the dataset and generates “What happened” and “What change over time” Graphs.
- Use Logistic Regression
It is appropriate for Boolean outcomes and generates “What will happen” Graphs.
- Perform K-fold Validation – It divides the data into k subsets. The result can be seen after the story is created by looking at the Rcode.
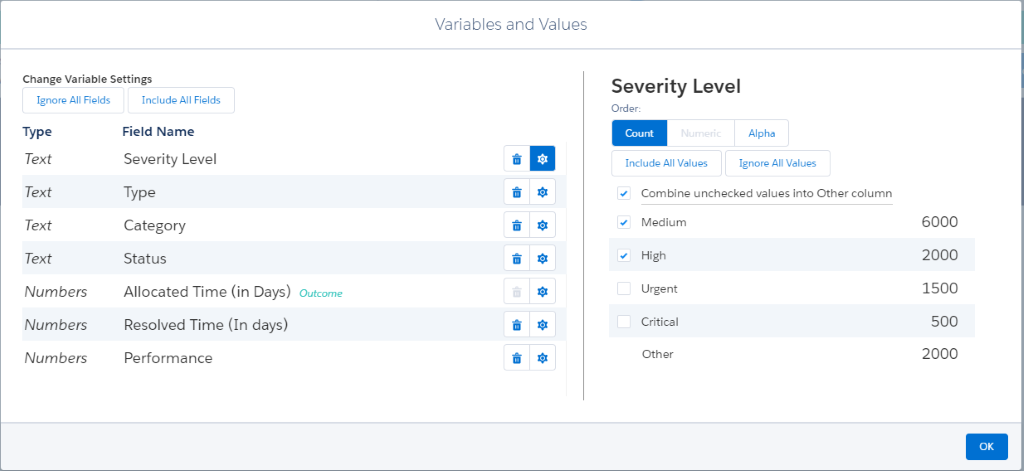
- Variables and Values – We can modify the fields for your story. Changes can be made here; it will not affect your dataset. To exclude a field, click garbage icon. To modify the settings for a field, click gear icon.
1. Date Fields – Set the range for date and time to analyse by Day, Month, Quarter, Year.
2. Text Fields – You can set the sort order for graphs by selecting Count, Numeric, Alpha and rename the field names. Two options are there
- Include Values
- Ignore Values to include and exclude the values of the specific fields. If you deselect the check box, then it will add to the other category.
3. Number Fields – Set the number of categories and if each category should have the same transaction count or same numeric width. Click the minimum and maximum values to edit them.
Better understanding of your data through visualizations
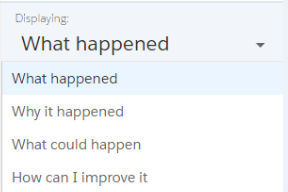
Einstein Data Discovery suggests unbiased answers for business questions so that we can focus on that metrics. You can get answers to business questions like “What happened”, “What will happen”, “Why it happened” based on the outcome variable.
What happened Graph
These are the primary graphs of your story.
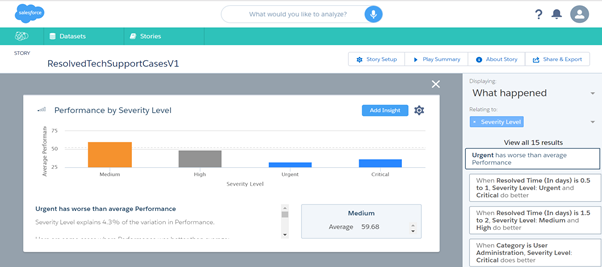
To view the “What Happened” graphs follow the steps given below,
- In the Displaying menu on the right, click Why It Happened.
- Click on one of the results.
Here, Average performance calculated by severity level.
- Medium is higher than average performance.
- High and critical has below average.
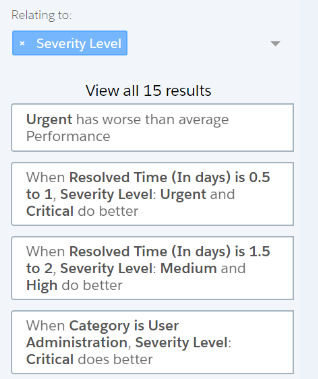
- Urgent has worse than average performance.
Why it happened
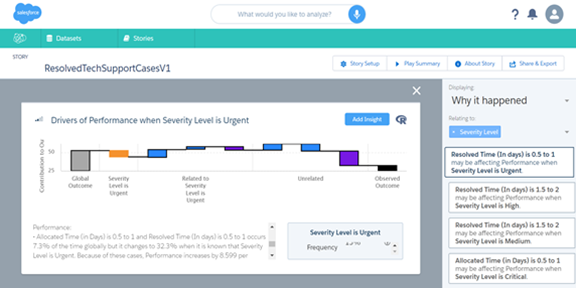
These are the diagnostic graphs. There might be several unrelated that contribute to a visual pattern. Global outcome variable will be the grey bar. You can explore the increase or decrease variables in that story.
To view the “Why It Happened” graphs follow the steps given below,
- In the Displaying menu on the right, click Why It Happened.
- Click on one of the results.
How Can I Improve It?
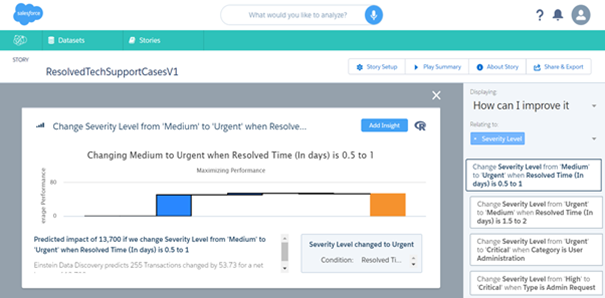
“How Can I Improve It” graphs are Prescriptive graphs. With these graphs, you can explore what is maximize or minimize your desired outcome. Einstein Data Discovery recommends specific actions, quantifies the expected impact, and explains the reasoning behind the recommendations.
To view the “How Can I Improve It” graphs follow the steps given below,
- In the Displaying menu on the right, click How Can I Improve It.
- Click any one of result in How can I Improve it options.
Modify the story settings
Story Setup
After creating story, it is easy to change the story setup and rerun the analysis by clicking story setup.
Play Summary
It is executive summary of the story.
- It has the mute, restart, skip options in the bottom of the page. It will show the visualization of entire story.
- Click Personalize Story in the bottom left corner to personalize the story. Click the thumbs up and thumbs down buttons make adjustment to the story before you have read it.

About Story
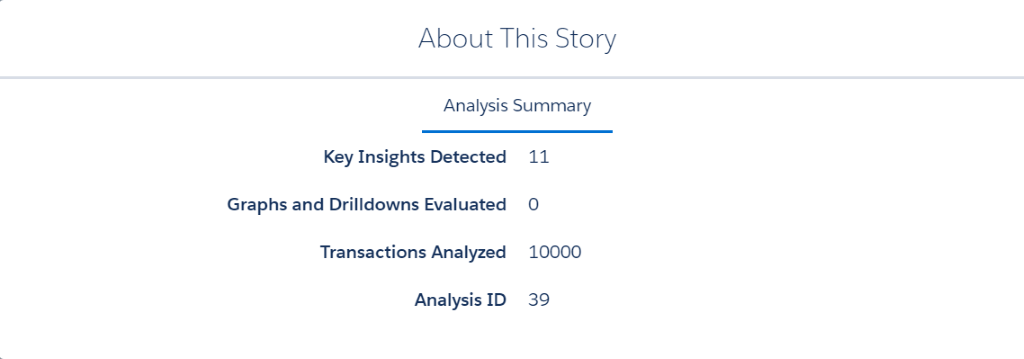
1.Click About Story

Details of the story will be displayed.
Share and Export the story
It is a great option available in Einstein Data Discovery to share your story with other users. You can also export customizable reports as MS word document or PPT.
Use case
- We have taken resolved case list of records from ABC Tech Support as our data set.
- It contains following columns in the .csv file,
- Severity Level – Critical, High, Urgent, and Low.
- Type – Questions, Issues, and Admin Request.
- Category – DocuSign, Report and Dashboards, User Administration, and Wish Cloud.
- Status – Closed.
- Allocated Time (in days) – 0.5 (for critical), 1 (for urgent), 1.5 (for high), 2 (for medium).
- Resolved Time (in days) – 0.5, 1, 1.5, 1, 2, 3, 4, 5, 6, 7, 8, 9, 10, 11, 12, 13, 15.
- Performance – 0 and 100 to indicate performance measurement.
Outcome variable – Performance used as an outcome variable in our story.

- Severity level, Type, and Status are used as an actionable variable.
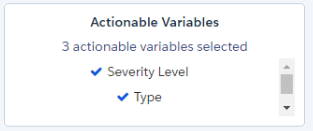
- All results will be based on performance variable.
- We can choose displaying option with business questions.
- We can set the relating to option with any field; It will show the results relating to that fields.
Pros
- No need to hire a Data Scientist.
- No need to design your own predictive models.
- CRM will be increasingly accurate.
- It will simplify your own work.
Cons
- Requires large amount of data to display visual representation of the data predictions in graph. Minimum of 10000 and above records are needed to show the graphs.
Conclusion
Einstein Data Discovery is very useful for business activities to chart everything with help of predictive analysis. It will portrait the business insights in pictorial representation and suggest some actions to improve your data to give some better results.
References


