In Spring ’17 Release, Salesforce has introduced seven new SAQL aggregate functions as measures to lenses in Wave. The new SAQL aggregate functions are First(), Last(), Median(), Stddev(), Stddevp(), Var() and Varp(). This article will discuss about the application of those new functions in various business scenarios.
Standard deviation:
In business, standard deviation is used to measure the volatility level. It is used to measure how much the return on the investment is deviating from the expected normal returns. If the standard deviation is low, we can conclude that the data are very closely related to the average and thus a reliable one. If the standard deviation is high, we can conclude that there is a large difference between the data and its average, and thus the data is not a reliable one.
In general, it is calculated using the following steps.
- First, we should take the average of the data points.
- Next, we should subtract the average from each data point individually.
- Then we should square each of the above resultant value (each individual value – average value).
- And then we should take the average of the above obtained squared values. This is said to be variance.
- Finally, we should take the square root of the variance.
Now we will take a business scenario to understand the usage of the standard deviation. We have the monthly profits of the previous year belonging to shares of three companies. Using standard deviation, we can analyze which company is better to invest?
The monthly profits earned through shares of Company A are 50000, 90000, 70000, 20000, 60000, 50000, 80000, 60000, 50000, 90000, 60000, 80000.
The monthly profits earned through shares of Company B are 70000, 30000, 30000, 90000, 30000, 50000, 85000, 90000, 60000, 60000, 85000, 90000.
The monthly profits earned through shares of Company C are 80000, 40000, 50000, 60000, 70000, 50000, 80000, 50000, 80000, 50000, 80000, 70000.
To find out the standard deviation:
There are two different functions available to calculate the standard deviation in a single click. The above five steps involved in standard deviation calculation is performed in background. We can apply the SAQL function to wave lenses by simply clicking on the respective function.
Stddevp():
This function is used to calculate the standard deviation for the entire population of the dataset. It is achieved by simply clicking on the stddevp() option as its measure.
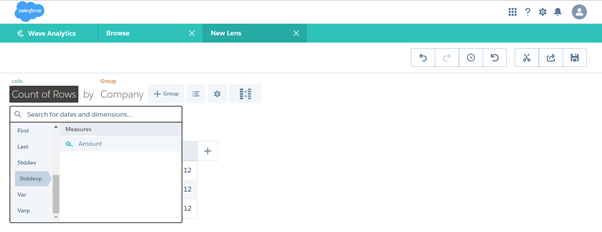
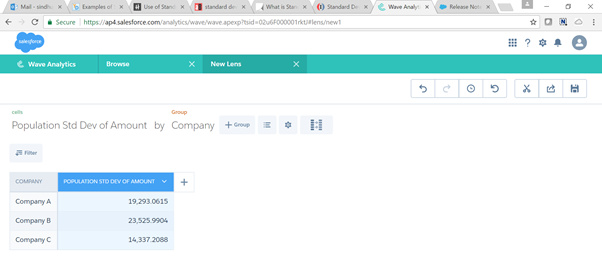
The standard deviation for the entire population of the dataset are calculated. From the obtained result, we found that the standard deviation of Company C is low compared to the other two companies. So, it is better to invest in shares of Company C because it has less risk.
Stddev():
This function is used to calculate the standard deviation for the sample of data instead of considering the entire population of the dataset. It is achieved by simply clicking on the Stddev() option as its measure.
Calculating standard deviation for only a sample of data will be helpful when we have a large amount of population. Because during manual calculation, it is hard to calculate standard deviation for a large population. So, we go for the option to calculate standard deviation for sample data alone. Though wave calculates the standard deviation in a single click, the option to calculate sample standard deviation is also made available to use.
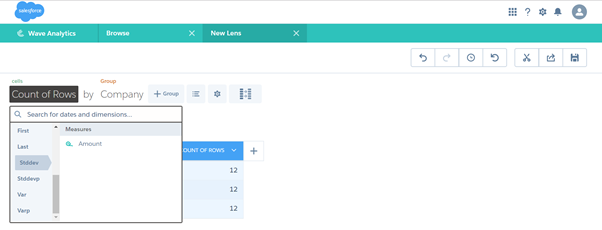
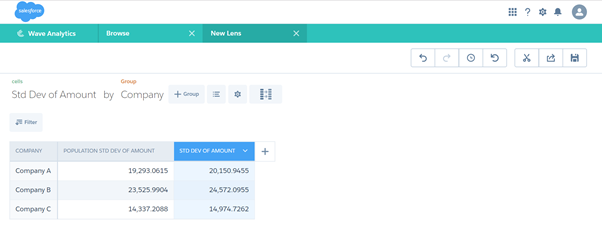
The standard deviation for sample data is calculated. The difference in resultant data is based on the difference made to variance calculation. Since we took only sample data, the variance is calculated by dividing the obtained squared values (in step 3 given in general calculation) by n-1. So the sample standard deviation varies slightly, but you can gather the same information as from population standard deviation.
To find the variance:
There are two different functions available to calculate the variance in a single click. The above four steps (in general steps section) involved in variance calculation is performed in the background. We can apply the SAQL function to wave lenses by simply clicking on the respective function.
Varp():
This function is used to calculate the variance for the entire population of the dataset. It is achieved by simply clicking on the Varp() option as its measure.
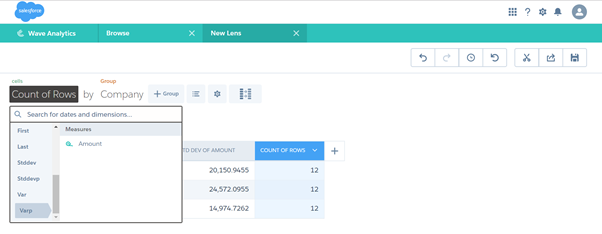
The variance for the entire population of the dataset are calculated. The four steps mentioned in general calculation are carried out in the background by wave. The result is rendered easily in the interface by simply clicking on the Varp() function.
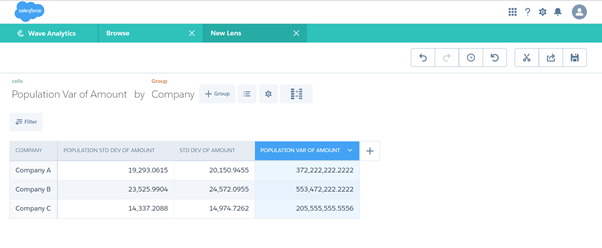
Var():
This function is used to calculate the variance for the sample of data instead of considering the entire population of the dataset. It is achieved by simply clicking on the Var() option as its measure. As discussed in standard deviation section, it is hard to calculate the variance for a large population in manual calculation. So, we go for the sample variance. Though wave calculates the variance in a single click, the option to calculate sample variance is also made available to use.
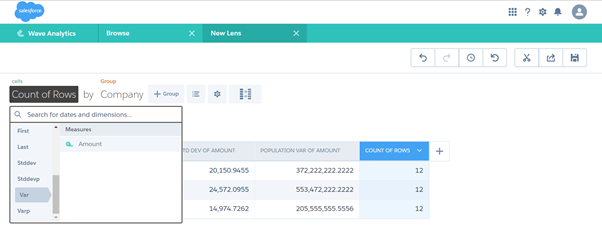
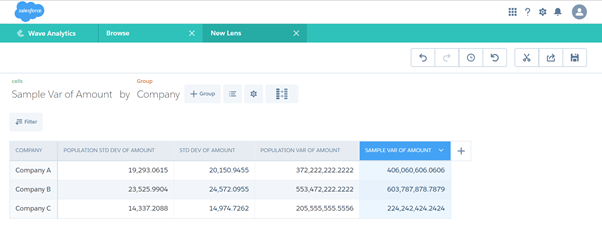
The variance for sample data is calculated. Since we took only sample data, the variance is calculated by dividing the obtained squared values (in step 3 of the calculation mentioned in general calculation) by n-1. So the sample variance varies slightly, but you can gather the same information as from population variance.
Median():
This function is used to find out the middle value of a sorted list. The median is used to separate the higher half of the data from the lower half. To find out the median, you should first sort the list in ascending order. If the count of data in the list yields an odd number, you can simply get the middle value. If the count of data in the list yields an even number, you have 2 numbers in the middle. So, you need to sum up those 2 numbers and then divide it by 2 to find the median value.
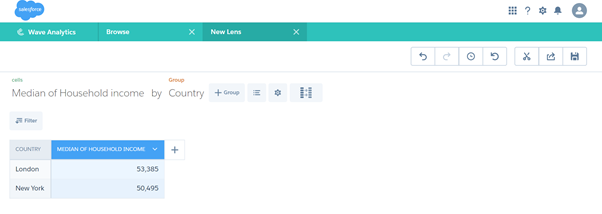
Ex. Median is helpful to find the economic health of an area based on the household income. The household income of New York for the past six months is $45000, $30000, $56300, $55990, $ 69000, $40090 and the household income of London is $56700, $20340, $40800, $50070, $70000, $60000.
You can find the median household income simply by clicking on the Median() function.
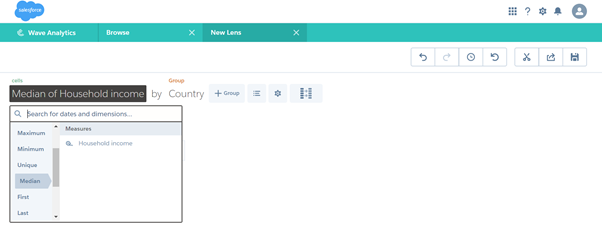
From the obtained result, the median of household income of London is found to be high. So we can come to the conclusion that the people living in London will enjoy the highest quality of life than the people living in New York.
To find the first and last values:
You can find the first value by simply clicking on the First() function and the last value by simply clicking on the Last() function. For ex. If you want to check the marks obtained by the student in the first and last test from a series of the conducted tests. The marks obtained by student A in a series of 5 tests are 79,67,78,89,80 and student B are 89,78,98,76,86 and student c are 90,87,80,67,77.
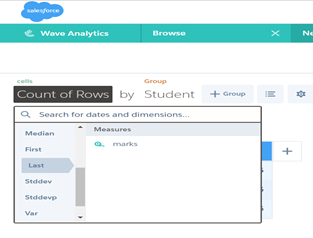
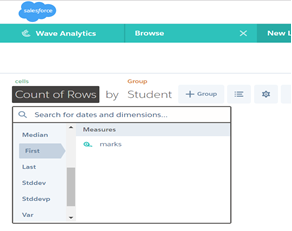
- First() b. Last()
[Text Wrapping Break]The output of the First() and Last() functions are
Summary:
Thus, the new functions introduced in Spring ’17 Release are very easy to use in various business scenarios. Though the SAQL aggregate functions involved many complex calculations in background, Wave provides easy to use interface through which the results can be obtained within a simple click.
References:
Web Link: Explore new functions in wave


