Introduction:
In Summer ’17 Release, Salesforce introduced Show Totals feature and Column Size configurations for value table. In general, value table in wave analytics is used to view the record – level details. This article will discuss about the application of those new features in various business scenarios.
Show totals:
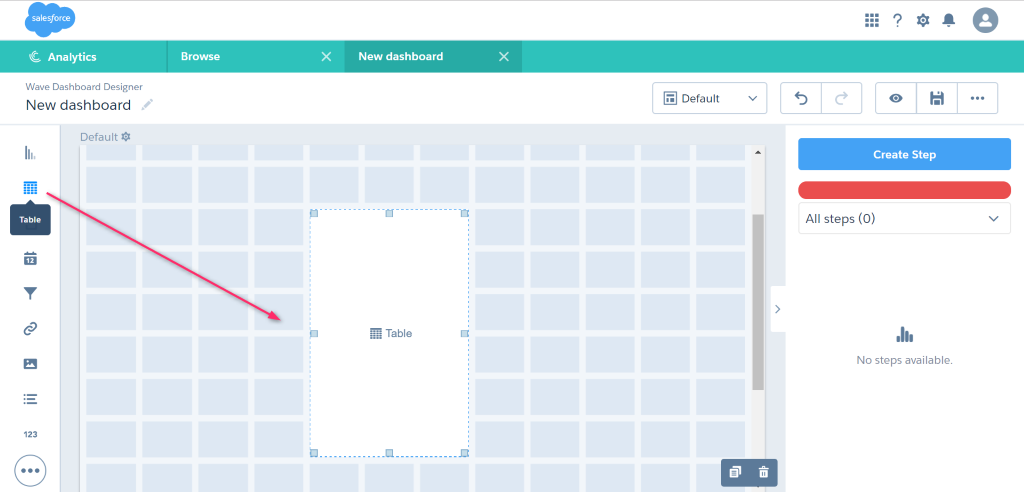
Step 1: Click the Table widget and drag it into the canvas area of the dashboard.
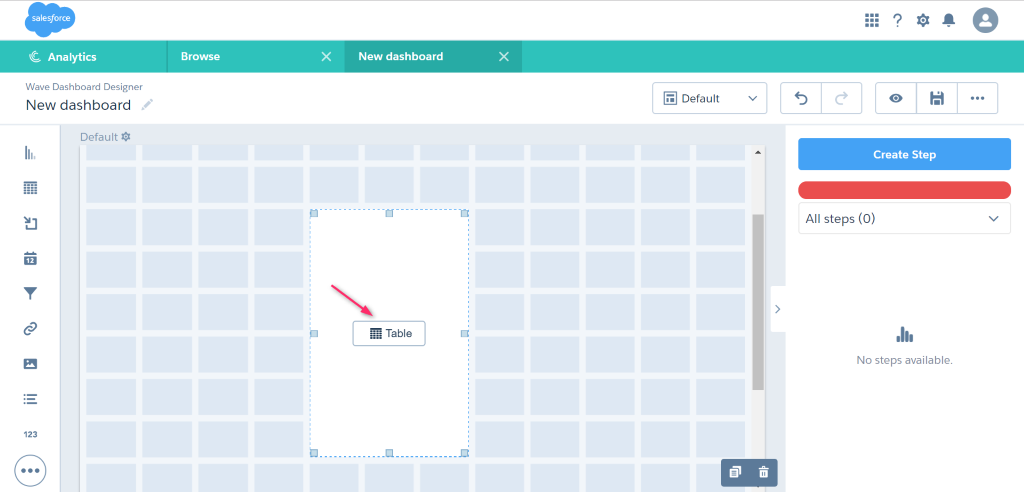
Step 2: Inside the widget, click the button to include a step.
Step 3: You can either create a new step or use an existing step. If you are creating a new step, you should select the dataset that contains the data you want to display.
Here, we have selected the Product Details dataset. The following screen appears and then we select the Values Table as the table type.
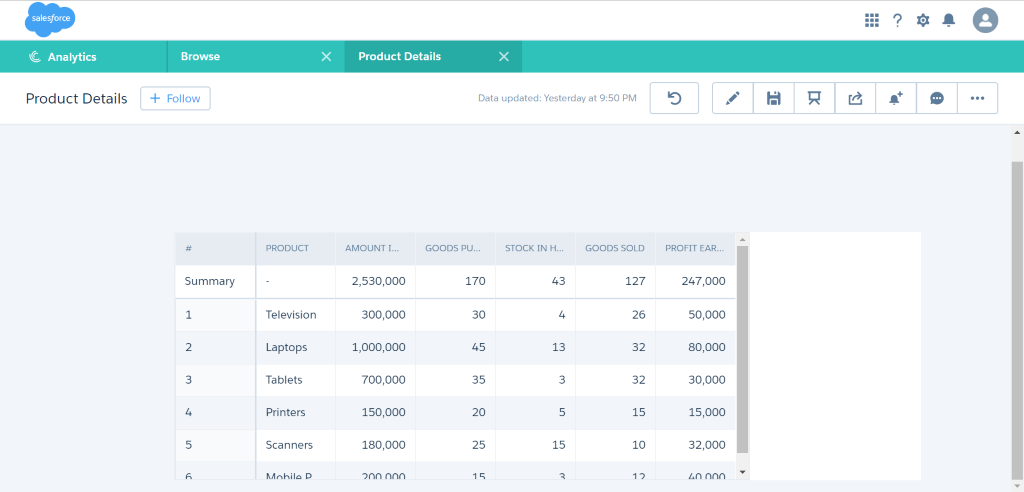
The value table shows the product details of an Electronic shop. It contains the name of the products, the amount invested in each product, how much goods purchased and sold in a month, the profit earned during that period, and the remaining stock in hand.
We have options to add and remove the columns under the Columns section (1) and filter the data of value table using the Filter by section (2) and edit the SAQL query using the Run Query option (3).
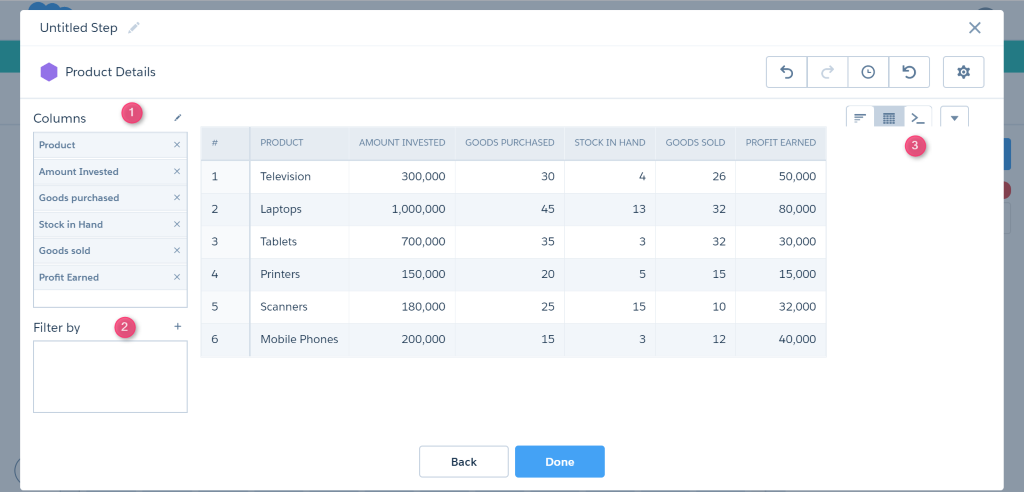
Step 4: You can calculate the total of each numerical column in a single click using the Show Totals feature available under the arrow mark.
The total value of each numerical column is displayed as shown below.

Click the Done button. The details of value table are displayed inside the table widget on the dashboard as shown in the below screenshot.

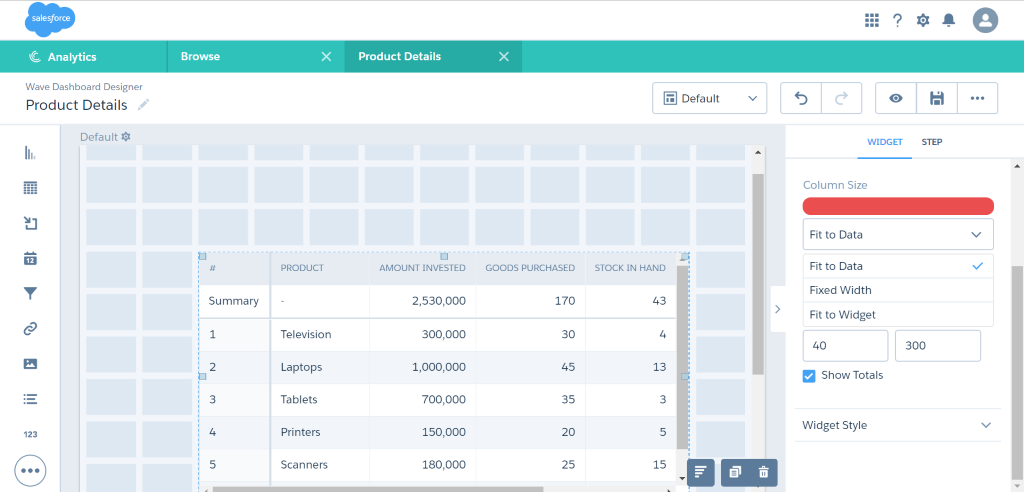
The Show Totals option appears in the widget properties only after enabling it in the step. We can toggle this option based on our requirements.
Column Size configurations:
We can control the column size using the 3 options. The options are Fit to Data, Fixed Width, and Fit to Widget. You can view the result of the column size configurations by clicking on the preview option on the dashboard.

Fit to Data:
This option will display the columns based on the length of the data. It will contain remaining space at the right side of the widget if the length of the data is less than the length of the widget.

Fixed Width:
This option will display each column with the same width. It will contain remaining space at the right side of the widget if the length of the data is less than the length of the widget.

Fit to Widget:
This option will display the column up to the entire length of the widget. This will ensure that no empty spaces are left at the right corner of the widget.

Summary:
Thus, we can easily calculate totals for each numerical column in a simple click using the Show Totals feature and control the column display using the column size configurations.
Reference:


